Difference between revisions of "Tutorials:Cadence:VerilogSimulation"
(Created page with "= Verilog Simulation = Left click CIW:Tools → Verilog Integration → Verilog-XL. The ''Setup Environment'' windows should appear. Fill in the appropriate fields as sho...") |
|||
| (5 intermediate revisions by the same user not shown) | |||
| Line 1: | Line 1: | ||
= Verilog Simulation = | = Verilog Simulation = | ||
| − | Left click CIW:Tools → Verilog Integration → Verilog-XL. The ''Setup Environment'' windows should appear. Fill in the appropriate fields as shown in the figure. It is recommended that you run your simulation in the local /tmp directory on the machine. Usually your simulation will run faster. | + | Left click '''CIW:Tools → Verilog Integration → Verilog-XL'''. The ''Setup Environment'' windows should appear. Fill in the appropriate fields as shown in the figure. It is recommended that you run your simulation in the local /tmp directory on the machine. Usually your simulation will run faster. |
: [[File:Tutorials-Cadence-Verilog_1.gif]] | : [[File:Tutorials-Cadence-Verilog_1.gif]] | ||
| Line 7: | Line 7: | ||
Left Click '''OK'''. | Left Click '''OK'''. | ||
| − | A pop up window will appear. This window is called the Verilog-XL Integration Control window. Start the simulation process by first clicking on Setup → Record Signals in the Verilog-XL Integration window. Make sure to choose All Signals as shown below. | + | A pop up window will appear. This window is called the Verilog-XL Integration Control window. Start the simulation process by first clicking on '''Setup → Record Signals''' in the ''Verilog-XL Integration'' window. Make sure to choose '''All Signals''' as shown below. |
: [[File:Tutorials-Cadence-Verilog_2.gif]] | : [[File:Tutorials-Cadence-Verilog_2.gif]] | ||
| − | There are (for us) three very important buttons on the control panel. The two that are currently active (not grayed out) are ''Start Interactive'' in the upper left corner of the panel, and the ''View Waveforms'' button in the lower right corner of the panel. The third | + | Left Click '''OK'''. |
| + | |||
| + | There are (for us) three very important buttons on the control panel. The two that are currently active (not grayed out) are ''Start Interactive'' in the upper left corner of the panel, and the ''View Waveforms'' button in the lower right corner of the panel. The third is the ''Continue'' button (currently grayed out) in the second row, second button of the panel. Next, click on the '''Start Interactive''' (top-left) button in the list of buttons provided in the Verilog-XL Integration Control Window or select '''Simulation → Start Interactive'''. | ||
: [[File:Tutorials-Cadence-Verilog_3.gif]] | : [[File:Tutorials-Cadence-Verilog_3.gif]] | ||
| − | Click on the Stimulus → Verilog | + | Click on the '''Stimulus → Verilog''' menu item. You will get the ''Stimulus Options'' window as shown below. Select the '''Edit''' button and press '''OK'''. This will help you create a stimulus file for the simulation of an inverter. |
: [[File:Tutorials-Cadence-Verilog_4.gif]] | : [[File:Tutorials-Cadence-Verilog_4.gif]] | ||
| Line 23: | Line 25: | ||
: [[File:Tutorials-Cadence-Verilog_5.gif]] | : [[File:Tutorials-Cadence-Verilog_5.gif]] | ||
| − | The above stimulus file starts with the input inp = 0 and then changes to 1 | + | The above stimulus file starts with the input inp = 0 and then changes to 1 at the time instant 25. Then it changes to 0 at 35 time instants later (25+35=60 time instants) and then to 1 at 75 instants (25+35+75=135 time instants) later. The simulation time is 235 units. The exact time of simulation is governed by the timescale command in the original functional view file. |
| − | Click on the Continue icon (second top icon in the second column) in the Verilog-XL Integration Control window or select Simulation → Continue. The Verilog simulation will begin. Pay attention to the messages that appear in the Verilog-XL Integration Control window to verify that the simulation is indeed running. You will be notified by those messages in | + | Click on the '''Continue''' icon (second top icon in the second column) in the Verilog-XL Integration Control window or select '''Simulation → Continue'''. The Verilog simulation will begin. Pay attention to the messages that appear in the Verilog-XL Integration Control window to verify that the simulation is indeed running. You will be notified by those messages in the window when the simulation has finished. |
| − | Next click on the very bottom right icon (View Waveforms icon) or select | + | Next click on the very bottom right icon ('''View Waveforms''' icon) or select '''Debug → Utilities → View Waveform'''. A pop up window will appear. It is the window in which you will view your simulation results and is called SimVision. |
: [[File:Tutorials-Cadence-Verilog_6.gif]] | : [[File:Tutorials-Cadence-Verilog_6.gif]] | ||
| − | From top right part of the SimVision window, select | + | From top right part of the SimVision window, select '''Send to Browser''' icon (the icon with a magnifying glass). The following window should open. |
: [[File:Tutorials-Cadence-Verilog_7.gif]] | : [[File:Tutorials-Cadence-Verilog_7.gif]] | ||
| − | Now select the waveforms that you want to plot. After you selected the waveforms, press the | + | Now select the waveforms that you want to plot. After you selected the waveforms, press the '''Send to Waveform''' button (It is located right next to the ''Send to Browser'' button. |
The waveforms should be as follows: | The waveforms should be as follows: | ||
| Line 41: | Line 43: | ||
: [[File:Tutorials-Cadence-Verilog_8.gif]] | : [[File:Tutorials-Cadence-Verilog_8.gif]] | ||
| − | Note: To see the complete waveform, please select View → Zoom → Out or the | + | Note: To see the complete waveform, please select '''View → Zoom → Out''' or the '''equality''' button right above the waveform window. |
| + | <noinclude> | ||
| + | |||
| + | [[Tutorials:Cadence:CreatingBehavioralModel|Prev]] : [[Tutorials:Cadence:ExampleLayouts|Next]] : [[Tutorials:Cadence:Main|Up]] | ||
| + | |||
| + | |||
| + | ---- | ||
| + | {{Template:CadenceDisclaimer}} | ||
| + | </noinclude> | ||
Latest revision as of 21:35, 12 November 2010
Verilog Simulation
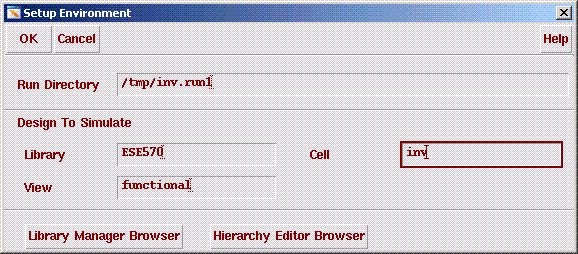
Left click CIW:Tools → Verilog Integration → Verilog-XL. The Setup Environment windows should appear. Fill in the appropriate fields as shown in the figure. It is recommended that you run your simulation in the local /tmp directory on the machine. Usually your simulation will run faster.
Left Click OK.
A pop up window will appear. This window is called the Verilog-XL Integration Control window. Start the simulation process by first clicking on Setup → Record Signals in the Verilog-XL Integration window. Make sure to choose All Signals as shown below.
Left Click OK.
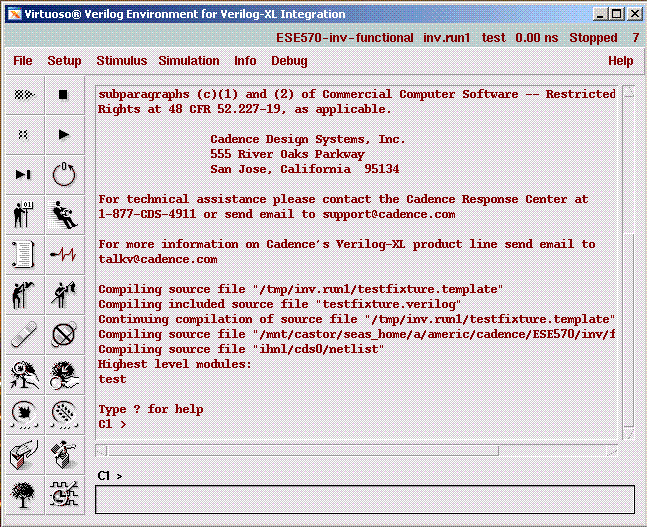
There are (for us) three very important buttons on the control panel. The two that are currently active (not grayed out) are Start Interactive in the upper left corner of the panel, and the View Waveforms button in the lower right corner of the panel. The third is the Continue button (currently grayed out) in the second row, second button of the panel. Next, click on the Start Interactive (top-left) button in the list of buttons provided in the Verilog-XL Integration Control Window or select Simulation → Start Interactive.
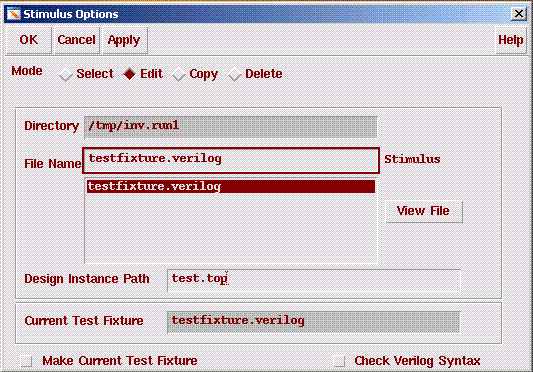
Click on the Stimulus → Verilog menu item. You will get the Stimulus Options window as shown below. Select the Edit button and press OK. This will help you create a stimulus file for the simulation of an inverter.
An Emacs window will appear. Modify the file as shown below:
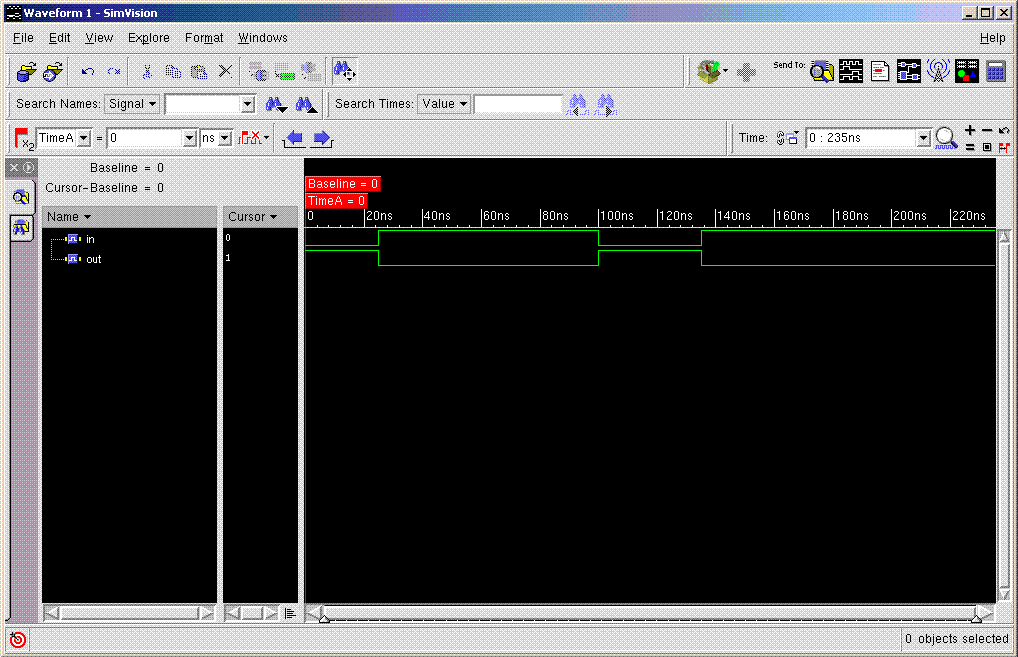
The above stimulus file starts with the input inp = 0 and then changes to 1 at the time instant 25. Then it changes to 0 at 35 time instants later (25+35=60 time instants) and then to 1 at 75 instants (25+35+75=135 time instants) later. The simulation time is 235 units. The exact time of simulation is governed by the timescale command in the original functional view file.
Click on the Continue icon (second top icon in the second column) in the Verilog-XL Integration Control window or select Simulation → Continue. The Verilog simulation will begin. Pay attention to the messages that appear in the Verilog-XL Integration Control window to verify that the simulation is indeed running. You will be notified by those messages in the window when the simulation has finished.
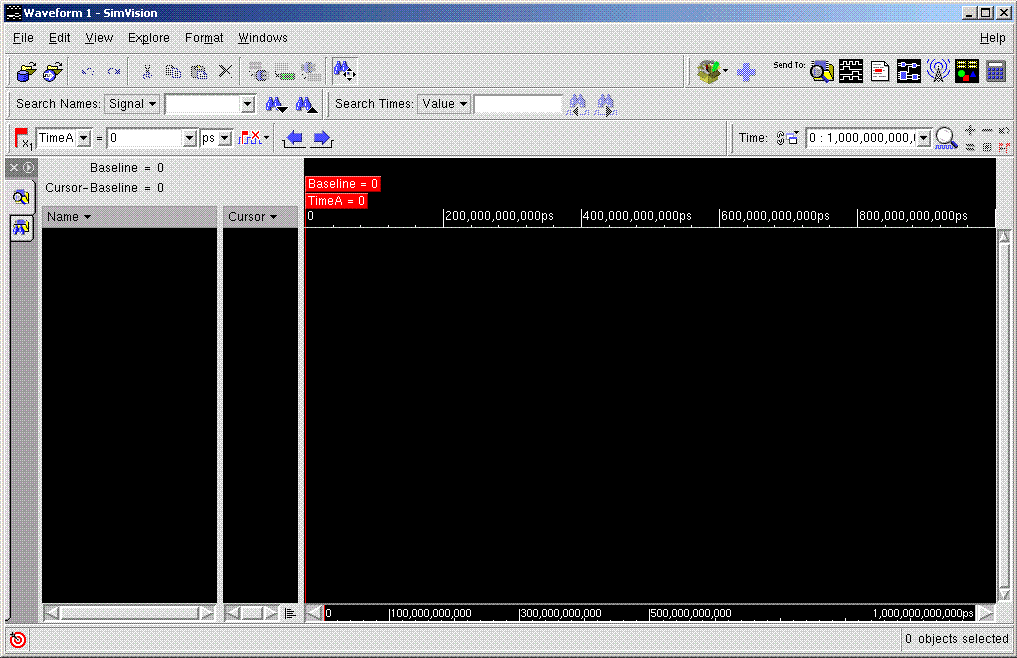
Next click on the very bottom right icon (View Waveforms icon) or select Debug → Utilities → View Waveform. A pop up window will appear. It is the window in which you will view your simulation results and is called SimVision.
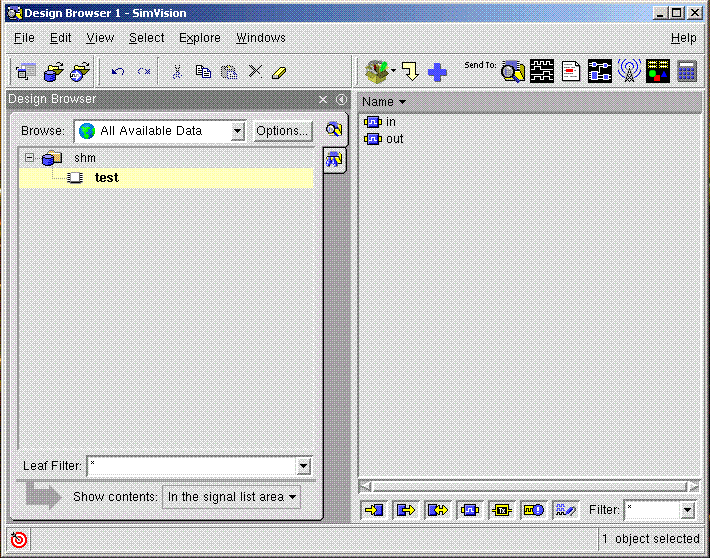
From top right part of the SimVision window, select Send to Browser icon (the icon with a magnifying glass). The following window should open.
Now select the waveforms that you want to plot. After you selected the waveforms, press the Send to Waveform button (It is located right next to the Send to Browser button.
The waveforms should be as follows:
Note: To see the complete waveform, please select View → Zoom → Out or the equality button right above the waveform window.
Information is provided "as is" without warranty or guarantee of any kind. No statement is made and no attempt has been made to examine the information, either with respect to operability, origin, authorship, or otherwise.
Please use this information at your own risk--and any attempt to use this information is at your own risk--we recommend using it on a copy of your data to be sure you understand what it does and under what conditions. Keep your master intact until you are personally satisfied with the use of this information within your environment."
Cadence® is a trademark of Cadence Design Systems, Inc., 555 River Oaks Parkway, San Jose, CA 95134
For web related questions contact: Viktor Gruev, Michael Hall
